The City
is a
Nervous
System
Every photo is part of a collective urban memory.
Urban Enthusiasm transforms millions of community photographs into dense point clouds — three-dimensional constellations of spatial data where every dot represents a precise coordinate captured from the real world. These point clouds become high-fidelity, living models of the urban fabric, preserving culture, embedding history, and bringing an emotional dimension to the built environment.
Core Thesis
Collective Spatial Memory
Every photo taken of a city is a data point in a shared spatial model. This isn't a social network — it's a communal memory engine. The point cloud is the skeleton. The community fills in the soul: the history, the emotion, the culture that no sensor can capture alone.
Temporal Layering
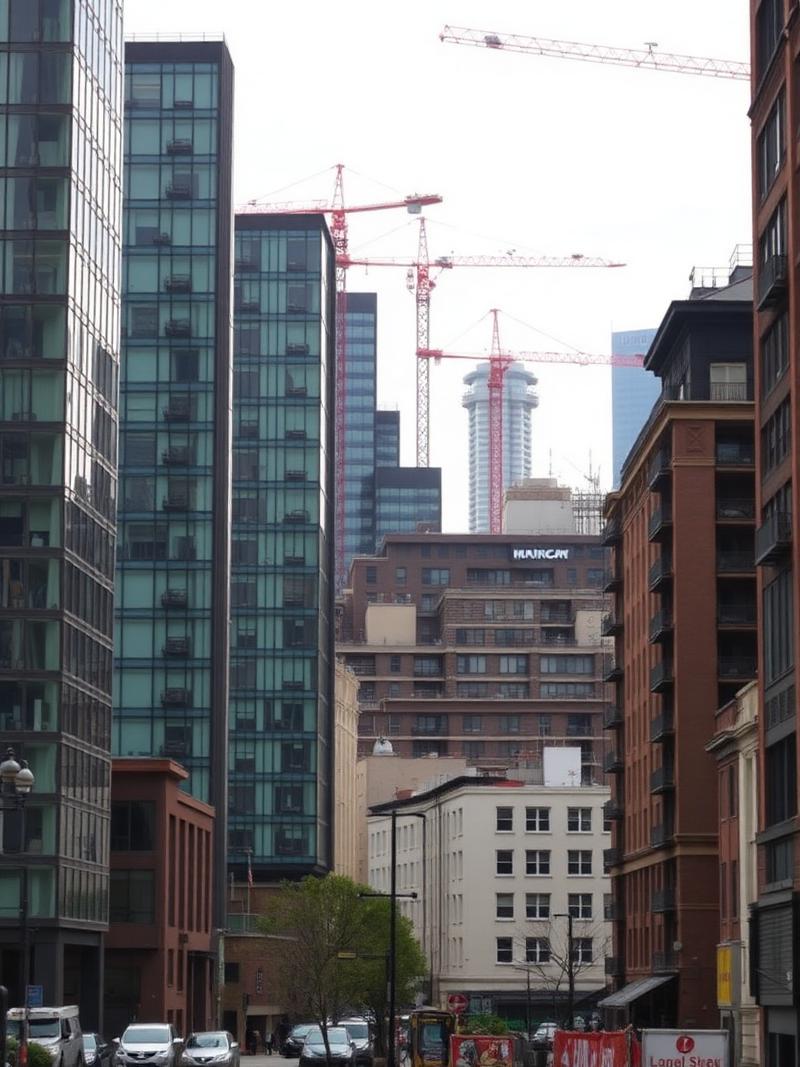
Every reconstruction is timestamped. Stack them and you get 4D city documentation — not just how a place looks, but how it changes. Construction progress, demolitions, seasonal shifts, gentrification patterns. "Show me this corner in 2024 vs 2026" becomes a slider, not an archive.
Critical Regionalism
Atlas resists the flattening of generic digital mapping by grounding spatial data in local experience, local culture, local memory. Every city's Atlas is fundamentally different because it's made by the people who live there. Google captures cities for people. Atlas lets people capture cities together.
Capture
Citizens document the mundane and the monumental. You don't need to know photogrammetry — just take overlapping photos of something interesting. The system figures out where it fits via GPS and visual feature matching.
Synthesize
Our spatial engine aligns millions of images into a unified, high-density point cloud. Content is organized spatially and temporally — layering history, metadata, video, and photo into a living 4D model of the built environment.
Preserve
Neighborhoods change. Buildings come down. Murals get painted over. Atlas makes that history persistent and spatial — buildings that are demolished live on in the model. Neighborhood character becomes measurable, not just anecdotal.
Public Infrastructure
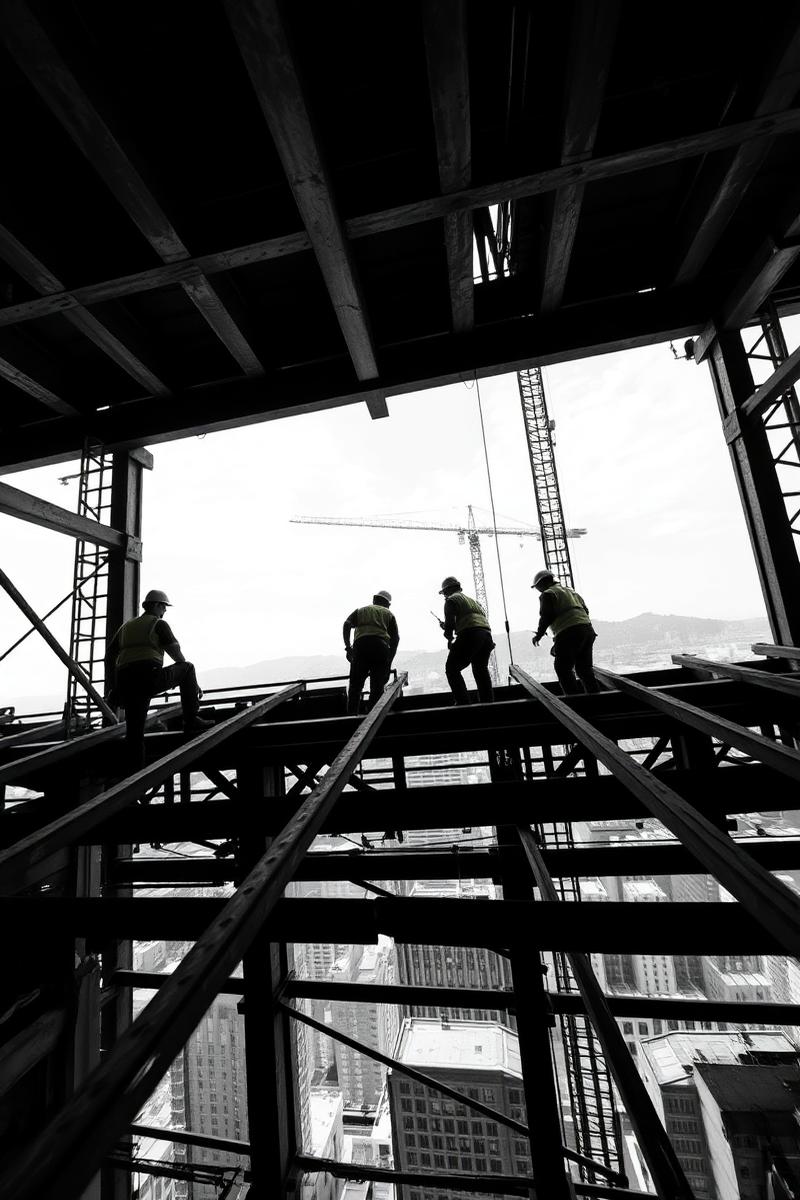
Who Builds
What Gets Built
Crowdsourced structural observation at city scale. Potholes, cracked sidewalks, deteriorating facades, bridge conditions, retaining walls — the public infrastructure that cities don't inspect often enough. Spatial data attached to every report, not just a pin on a map.
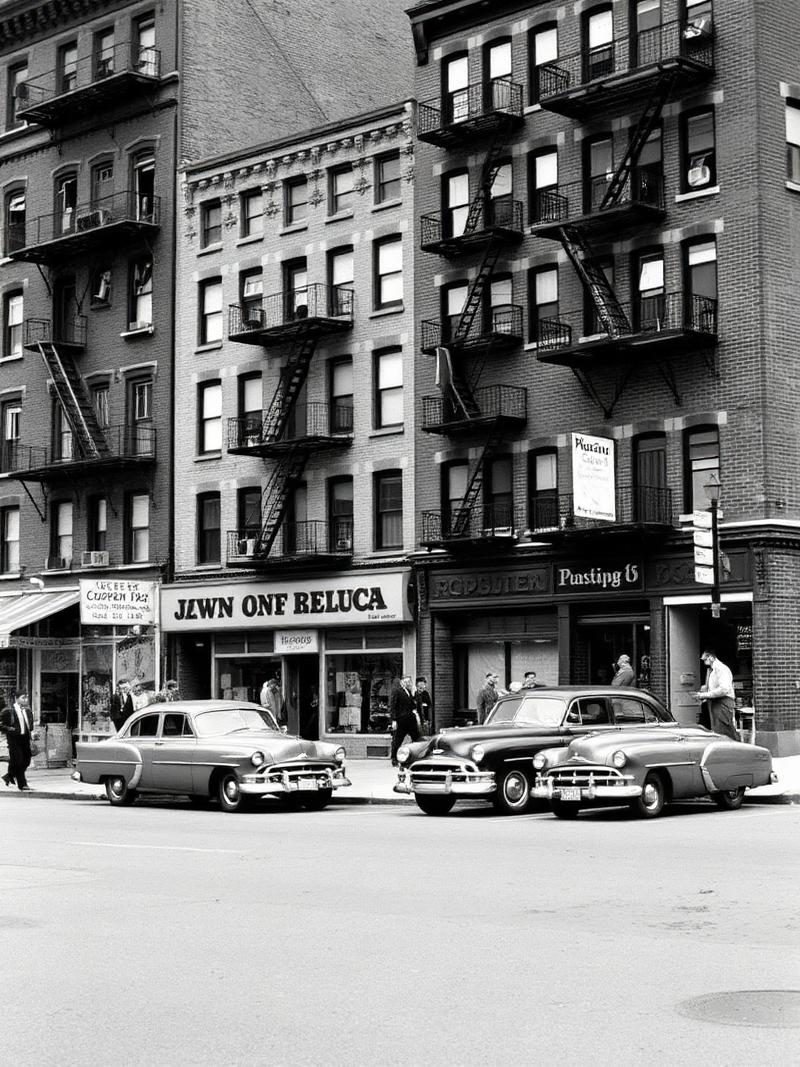
Temporal Layering
The Palimpsest
What was here before, what replaced it, what will replace this. Historical photos georeferenced and placed in 3D — floating in space exactly where the photographer stood. Tree canopy coverage, shadow studies from real geometry, pedestrian infrastructure quality mapped over time.
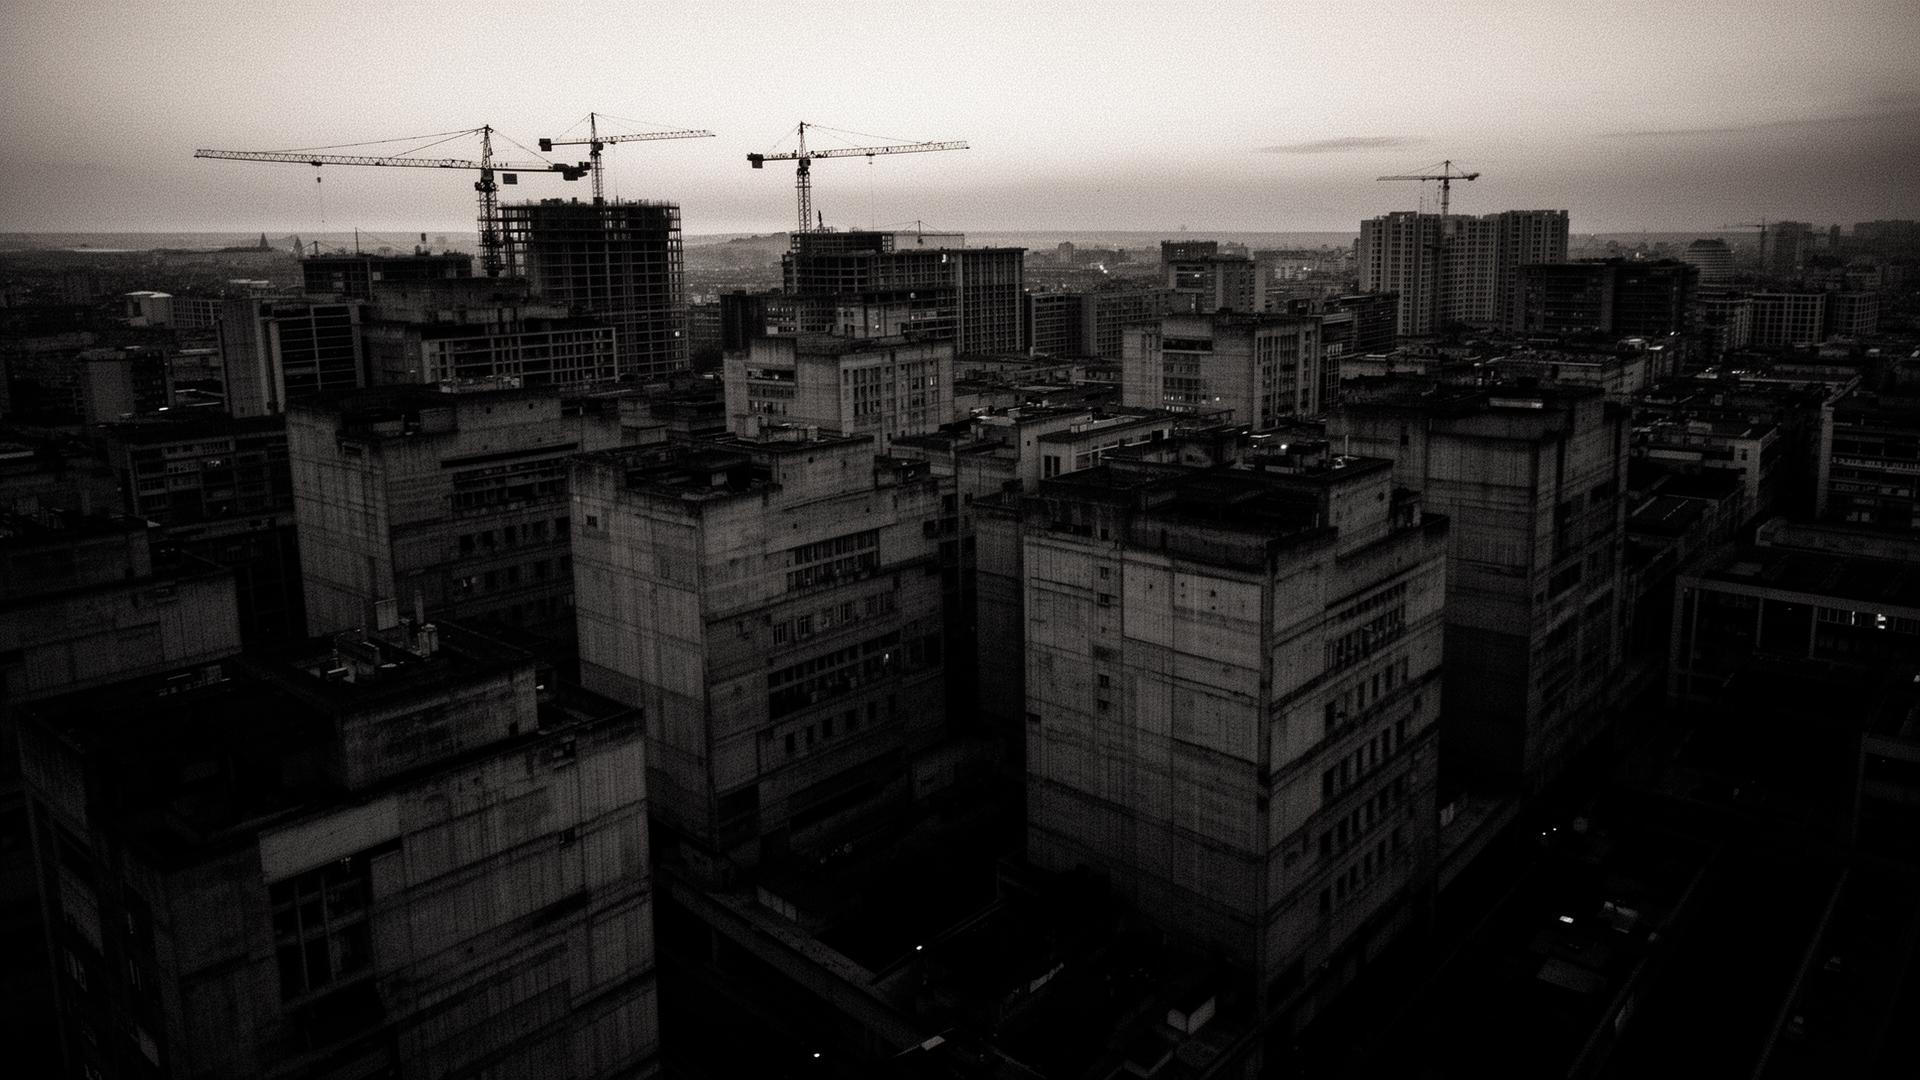
The City
remembers everything
Google captures cities for people. Atlas lets people capture cities together. The difference is ownership, granularity, and frequency. Google drives by once a year. Residents walk past every day. Every point is a vessel for meaning — history, emotion, culture, labor — not just geometry.
Persistent locations people keep re-scanning — a building, a park, an intersection. Nodes accumulate density over time. The more people scan, the richer the model becomes.
One-time captures — an event, a protest, a pop-up market, a mural being painted. Temporal snapshots that freeze a moment in the city's spatial memory.
Data Architecture
Every Point Is a Vessel for Meaning
xyz coordinates, accuracy, source images, photogrammetric alignment
Capture date, construction date, historical period, 4D timeline position
What is this made of, who supplied it, facade condition surveys
Community stories, oral histories, murals, street art documented before they disappear
Permits, zoning, ownership history, proposed vs. actually built comparisons
Tree canopy, shadow studies from real geometry, air quality, seasonal shifts
Potholes, cracked sidewalks, bridge conditions, structural deterioration
Memories, associations, why this matters, neighborhood character made measurable
Export meshes, CityGML, 3D Tiles, AR overlays, open API for researchers and civic groups
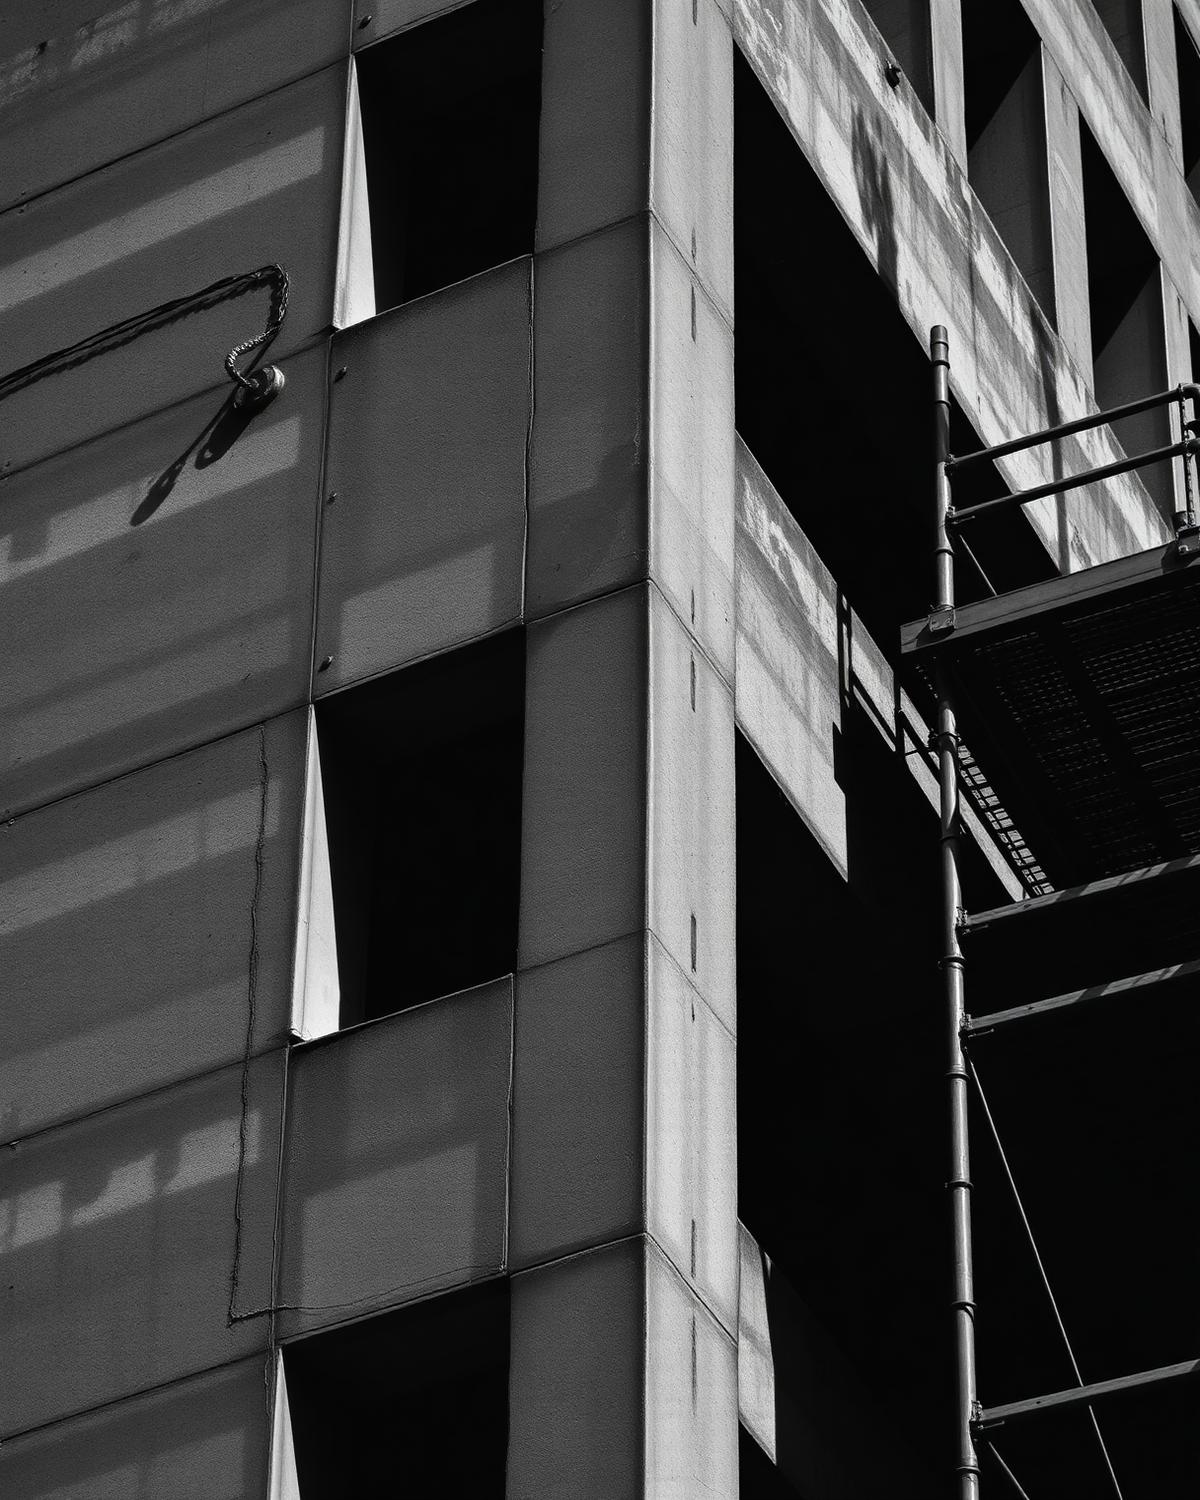
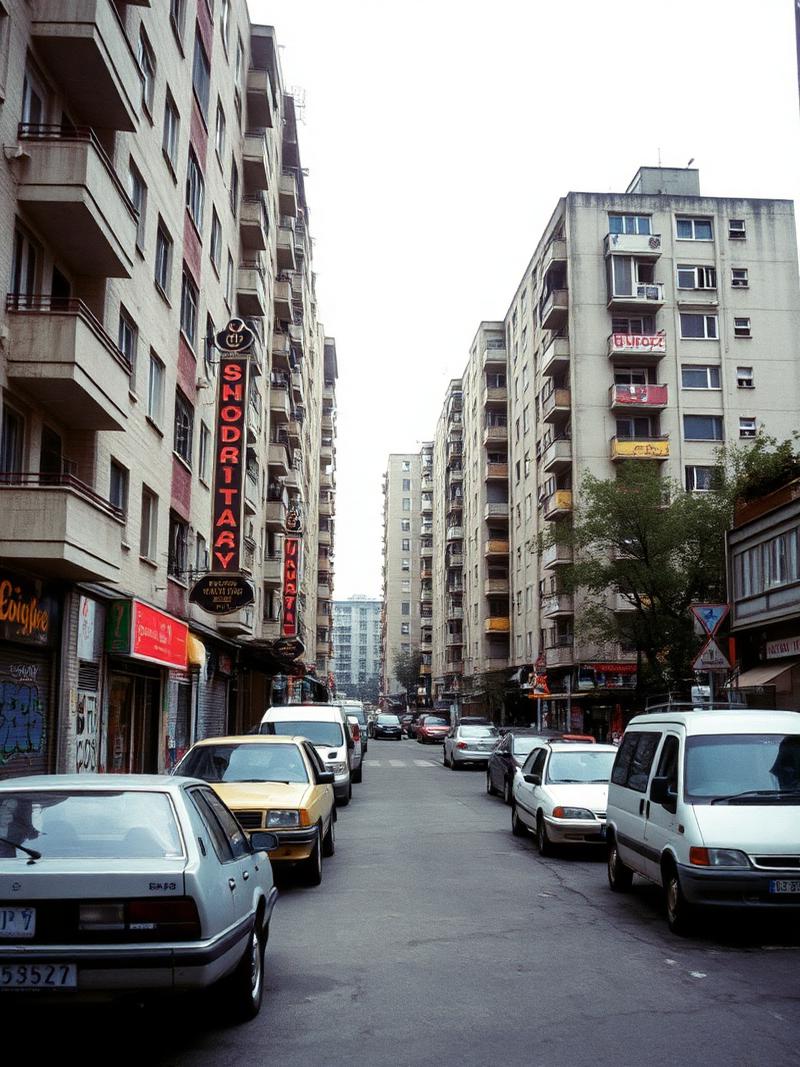
Individual building scan showing facade, structural edges, mechanical rooftop equipment, and adjacent structures. Each point carries spatial, material, temporal, and cultural metadata.